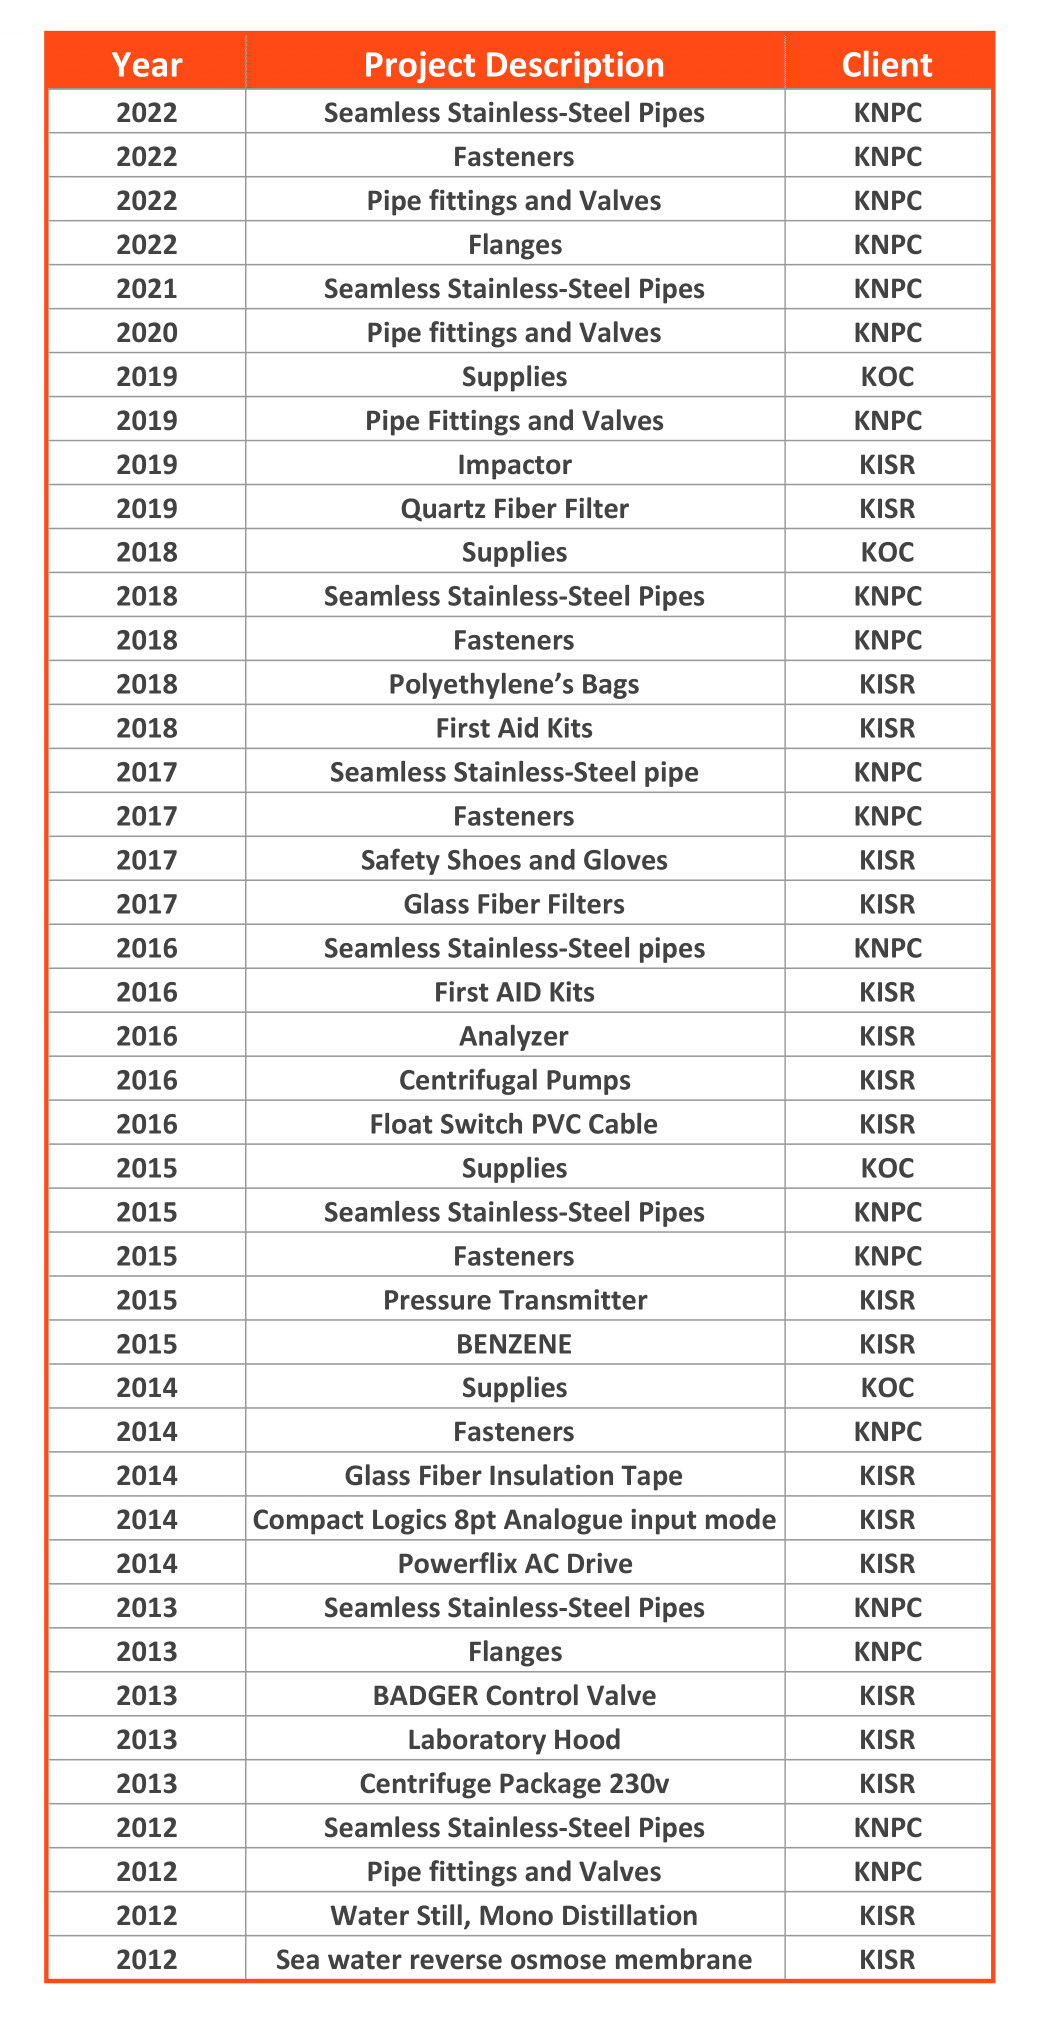
Products & Supplying Projects


Pilot Of Radial Drilling Services
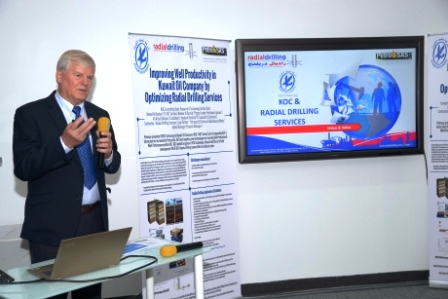
Improving Well Productivity in North Kuwait Well by Optimizing Radial Drilling
Reservoir Description:
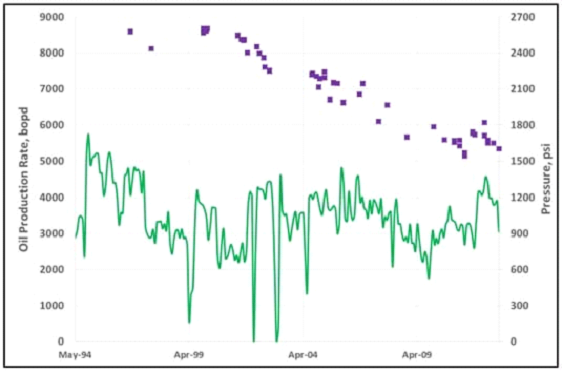
The field is located in the northern part of Kuwait and it is a mature field. The reservoir is a layered sandstone reservoir and developed in most areas of the field in channel type. This channel system is laterally continuous as interpreted from the isopach map. It has been subdivided into four layers based on dominant facies and reservoir pressure. The most important layer 1B contains about 29% OOIP. The average thickness is 13 ft. This layer has contributed about most of the total field oil production until date. The field is a brown field and is on production through ESPs.
The production is under depletion drive with weak aquifer support with waterflood is ongoing partially. The reservoir has moderate to good permeability. The reservoir is oil bearing with quality of 31 to 32 API. Over the time, the reservoir pressure declined from the initial levels, close to the bubble point pressure.
Local sinks around wellbore were the cause of primary concern. The pressure decline had an adverse effect on the operation of ESPs. Since the pressure in reservoir was found to drop below bubble point pressure in the near future as predicted by the simulation model, eventually leading to development of gas cap at the crest in years to come. This had an adverse impact on recovery. Pockets of unwept oil affecting the sweep efficiency of the layer were noticed. All these factors were dramatically increasing the rate of decline. The well is drilled and completed in the flank area of the field. The initial objective was to complete the well as a dump flood injector to provide pressure to the mentioned layer in order to maintain the pressure and support the ESP operations in the nearby wells. However, based on the OH data recorded; it showed a hydrocarbon potential in the target zone. Therefore, the well is completed as a single ESP producer. After a few years of production and reviewing the available data, it was believed that a significant amount of hydrocarbon still exist in this area of the field, however the well is producing with a very low flow rate due to formation damage caused by drilling and completing operations and subsequent workover operations.
Studies and several discussions were carried out to find the best available technique to unlock the existing potential and maximize the well production a minimal cost.
Issues and Uncertainties:
When it comes to drilling this reservoir, the formation damage is the main concern due to very low reservoir pressures. The reservoir is normally drilled and completed by OBM weighting from 9.5 ppg to 10.5 ppg depending on the mud losses during drilling operation. With this mud weight, the formation is subjected an overbalance of + 3500 psi causing mud losses into the formation.
At this stage, the formation damage well certainly occurred and has been seen in many wells drilled earlier in this part of the field. However, the question is how to overcome and bypass this damage and maximize the well productivity. From lesson learnt, that acid stimulation is not effective to remove the damage around the wellbore due to lack of core studies and complex lithology to perform lab core analysis. It is believed that the damage has gone quiet beyond the wellbore area. The thinking is focused on how to overcome the near wellbore damage, bypass it, and extend the drainage area. Therefore, radial drilling technology was evaluated and studied extensively to ensure successful operation and promising results.
The near wellbore area is the most important part of the reservoir where the flow area is reduced and the flow streamlines are trying flow through perforation tunnels. The below fig. shows that most noticeable damage affects the well in the first 30 cm or 12 inches of the formation. The problem is more critical when the zone of interest is considerably permeable because it would be easier to damage and can have a major impact on productivity. The pressure drop across an unfractured wellbore shows the importance of the near wellbore on inflow. If this area is significant damaged, the effect is immediately noticeable. Below Fig below demonstrates that shallow damage at different damage percentages, is the most common and makes the biggest impact on production. It may take significant damage to create large drops in production. The problem, however, is that the highest permeability zones are the easiest to damage, and that can have a major impact on productivity.
Well Performance before RDS:
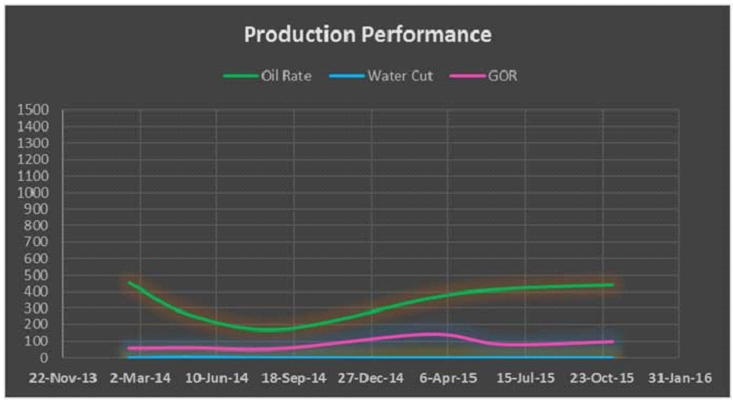
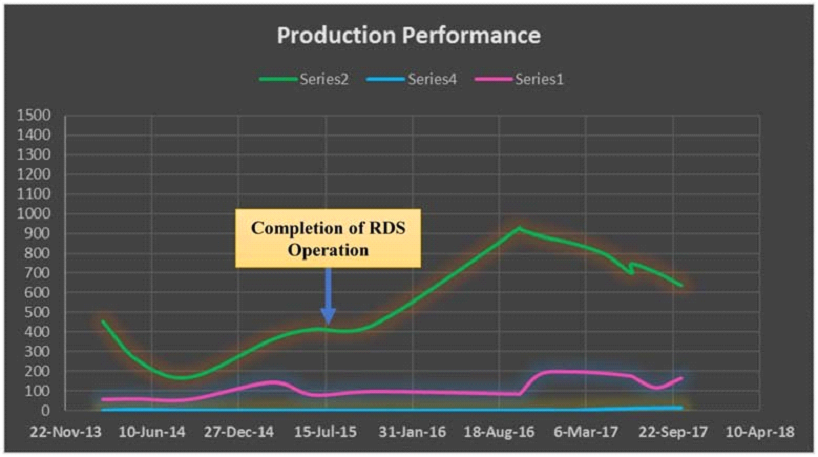
The well was drilled in the flank area of the field as dump flood well in order to provide pressure support for the subject zone 1B. However, after OH logs have been interpreted, a considerable amount of hydrocarbon has been identified. During completing of this well, the mud system was designed to be 12.5 ppg to overcome the top high-pressure water. Once the drilling operation reached the top of the interest zone 1B, the mud weight was reduced to 9.0 ppg to reduce the losses into the zone of interest. Even with 9.0 ppg mud, it is believed that the overbalance was so huge, the zone was subjected to overbalance of + 3500 psi and since the reservoir pressure is low, it is believed that the formation has been damaged severely. The below figure shows the production performance of the well when it was producing with very low rate + 400 BOPD (zero WC) with very low intake pressures around 400 psi at pump setting depth.
Well Performance after RDS
Post evaluation of the RDS operation has been taken up by different team members. To compensate for the promising results of the RDS operation, a bigger capacity of ESP has been designed to deliver total fluid of 539 – 1161 bbl/day expected from the treated layer. Previous ESP design was s smaller capacity pump of 340 – 650 bbl/day. Initial promising results were noticed during the ESP function test period, where the oil traces has started showing up on testing unit just after 16 hrs of testing. The water cut has dropped during the test from 100% (kill fluid) down to 26% just after 24 hrs of starting the test with stable downhole pressures across pump intake. This is something unlikely to happen in these wells, except in newly drilled wells.
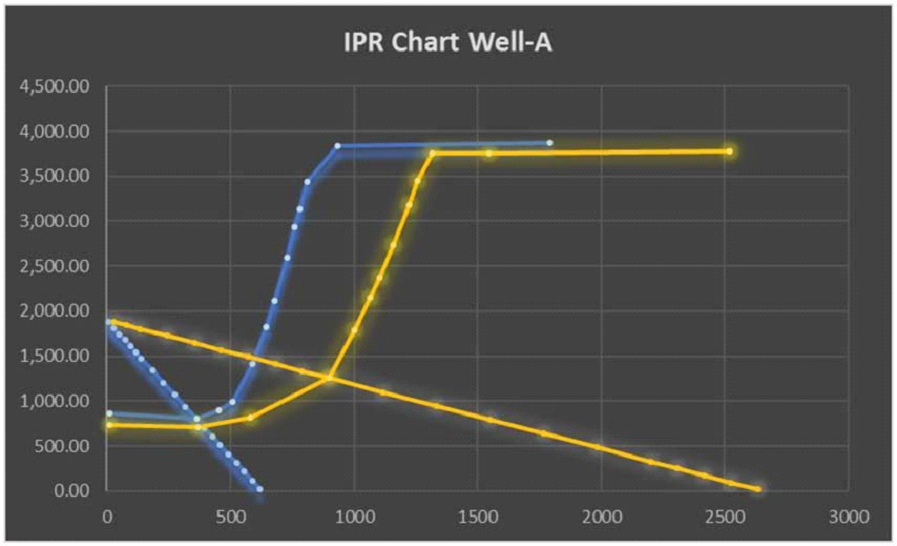
PipeSim model ha been construed for the mentioned well to compare the production index before and after the radial drilling operation. The Fig.shows the significant improvement in productivity index and AOF (yellow trends). As mentioned above, a bigger pump has been installed to cover wider range of fluid rate to take the advantage of the productivity improvement.
Subsequent portable testing has been done to evaluate the surface rate and confirm sustainability. The Fig. below shows the oil/watercut/GOR comparison before and after radial drilling operation. The well behavior has been stable for more than 2 years. However, the little kick down show at the last test is related to the little increase in GOR. The increase GOR is resulted from the accumulation of gas in the annulus for extended period and/or in the pump stages. A remedial action will be taken to bleed the gas from the annulus to bring back the well to its optimum rate or go with bullheading flushing to remove gas locking. Well test anayslysis has been carried out during well shutdown and pressure buildup to evaukate the post RDS treatement skin. The dlta P skin has been calculated to be −22.5.
Pilot of Radial Jet Drilling Technology in KOC Fields:
Supplying Projects